The Pour-Over Protocol
My doctor told me to cut back on coffee. I ran a pre-registered experiment on myself, with the goal of making every cup by hand, to see if I would drink less without missing it. In the end about half my cups were made by hand.
Concluded
My role
Designer, researcher and the one tested
- Type
- An experiment on myself
- When
- January 6 to February 21, 2024
- Design
- A-B-A, eight weeks
- Pre-registered
- January 5, 2024
- Planned an eight-week experiment on myself and wrote down the goal and four ways it could fail the day before the first cup.
- Designed two iPhone Shortcuts, Brew a Cup and Log a Cup, that talked me through each pour-over and logged every cup by voice.
- Ran a diary study on myself for all eight weeks and checked it against eight recordings of myself brewing.
- −44% coffee, against a goal of 20% less written down before the first cup
- 32→18 cups a week, and still 18 in the two weeks after the guide and reminders stopped
- 3.69→4.50 average score out of 5: the cups I kept were better, not worse
- 56 of 56 days the diary was filled in, logged by voice with wet hands
Summary
My doctor told me to cut back on coffee. She wanted me down to about one a day; I set my own target from that. I did not know how much I was really drinking, and I wanted to cut back without swapping coffee for something worse.
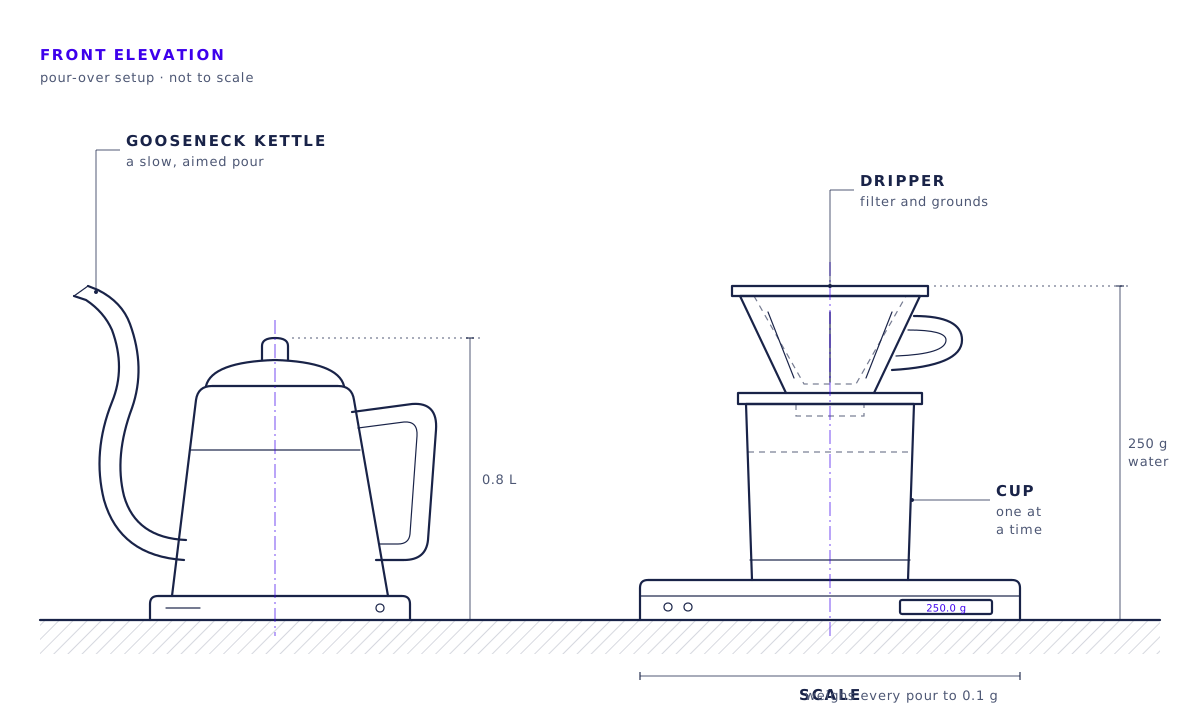
So instead of limiting my cups, I set out to make each one take more work: a pour-over, made by hand, one cup at a time. If a cup takes ten minutes, you only make it when you really want it. The goal was every cup by hand; in the four by-hand weeks I made about half that way, 36 of 72. I wrote down the goal before I counted a single cup, designed two iPhone Shortcuts to guide and log my cups, and counted for eight weeks.
Who was involved
- Me The only person tested, and the one running the test.
- My doctor Told me to cut back and wanted me down to about one a day. Checked in at Week 4 and said to keep going, and at Week 6 we settled on the 44% drop as acceptable.
Context
Thirteen cups a week came out of the machine every afternoon without my thinking about it. When my doctor told me to cut back on coffee, she wanted me down to about one a day; I set my own target from that. I guessed I drank three or four cups a day.
This was never a medical experiment. It counts cups, and it was never meant to replace my doctor's advice.
Research
Before changing anything, I ran a diary study on myself: for two weeks I wrote down every cup and scored each one from 1 to 5. That gave me my baseline, the normal amount any change would be measured against. It was 32 cups a week, about a cup a day more than I had guessed. "Way more than I thought," I wrote in my notes.
Then came four weeks of trying to make every cup by hand (I managed about half) and two weeks back to normal, to see if it stuck. Researchers call that an A-B-A design. During the by-hand weeks I filmed myself brewing eight times and checked the recordings against the diary. Four checks failed: once my diary was a cup short, and three times my own timing ran 68 to 100 seconds short of the recording, even after I changed how I timed myself.
Research
I kept the diary every day for all eight weeks. During the four by-hand weeks I also recorded myself brewing, all eight times I had planned to, and checked the recordings against the diary. On paper it all went perfectly: 56 of 56 diary days, and only 2.1% of the optional questions left blank. Underneath, it was messier: four of the double-checks failed. One found my diary a cup short. Three found my own timing ran 68 to 100 seconds short of the recordings, and changing how I timed myself after the first miss did not fix it. One Week 4 entry I filled in the next morning. All 16 files are here to download, together or one at a time.
| Week | Phase | Cups | Satisfaction |
|---|---|---|---|
| W1 | Normal weeks | 30 | 3.73 |
| W2 | Normal weeks | 34 | 3.65 |
| W3 | By-hand weeks | 21 | 3.62 |
| W4 | By-hand weeks | 18 | 4.33 |
| W5 | By-hand weeks | 17 | 4.71 |
| W6 | By-hand weeks | 16 | 4.81 |
| W7 | Back to normal | 19 | 4.53 |
| W8 | Back to normal | 17 | 4.47 |
Null hypothesis
The two lines on the chart come from my hypothesis, written down before I started: drink less, and enjoy it at least as much. The way this could go wrong is drinking less but enjoying it less. The lower line (3 out of 5) is the middle of my scoring scale, "just okay". If any week dropped below it, the cups I still drank would be worse than before I started, and the experiment would fail. The upper line (4 out of 5) is the tougher goal: my baseline cups averaged 3.69, so staying above 4 means the cups I kept were better than before. Landing between the two lines would mean it didn't fail, but it didn't really succeed either.
Falsification criteria
Each one is scored against the pass mark I set before starting. The day-by-day log was rebuilt afterwards, clearly marked, and it adds up to the same weekly totals. The list of gaps below explains why.
| ID | Fails if | Threshold | Actual | Result |
|---|---|---|---|---|
| FC-001 | reduction <20% | 0.2 | 0.44 | PASS |
| FC-002 | satisfaction <3.0 | 3 | 3.62 lowest | PASS |
| FC-003 | abandonment before Week 6 | complete Week 6 | completed all weeks | PASS |
| FC-004 | washout rebound to baseline | no return to baseline | 18 vs 32 baseline | PASS |
Baseline weeksWeeks 1 and 2
Observation only
“Write down every cup, change nothing” 64 cups in 14 days: 4.57 a day, scored 3.69 out of 5, with 66% of cups drunk at work.
By-hand weeksWeeks 3 to 6
Active
“Every cup a choice” 72 cups in 28 days: 2.57 a day, scored 4.37 out of 5. I made 36 of them by hand, half. My skill score from the brewing recordings went from 0.14 to 1.0 (out of 1), and the share of cups I drank at home rose from 27% to 57%.
Back to normalWeeks 7 and 8
Observation onlyHeld
“Does it stick when I stop trying?” 36 cups in 14 days: 2.57 a day, scored 4.50 out of 5. I still made 42% of my cups by hand.
Known gaps
- My written goal said my cups had to stay above 3 out of 5. Everywhere else I held myself to the tougher 4, and that is the line I scored against.
- I planned to export my blood pressure every day, but I stopped the daily readings at Week 4 (on 29 January 2024 I noted “BP too noisy day-to-day”). I kept taking a reading once a week. The readings stay private and are redacted in the files. The weekly log follows the rebuilt calendar, so its last date, 24 February, falls after the day I stopped counting.
- My design checklist asked for every cup in the by-hand weeks to go through the Brew a Cup Shortcut. Only half were made by hand, so that check fails as written, and the Shortcut's own log was not kept to count it.

Two normal weeks where I just counted to get my baseline, four weeks of trying to make every cup by hand, then two weeks back to normal to see if it stuck. The two normal weeks told me how much I really drank before I changed anything. Every cup got a score from 1 to 5 the moment I drank it. Eight times, I filmed myself brewing and checked the recordings against the diary. I wrote down every goal before I counted the first cup.
I was the only person in this, and I ran it, so I knew every goal while I was making the numbers. Nobody else took part, and nothing was hidden from me, so the only comparison is me against myself in a different month. Just watching yourself this closely can change what you do. The blood-pressure readings were only there to keep an eye on things. Eight weeks is all it covers.
Design
I designed two Shortcuts, Apple's free iPhone app for snapping simple steps together. Brew a Cup speaks each of the nine pour-over steps out loud, from heating the kettle to 200°F to the last drip. Steps with natural timing, like the three-minute grind, get a timer; the rest wait until I say "ready."
When the cup is done, it hands off to Log a Cup, which asks me to score the cup from 1 to 5 and saves the answer with the time. No typing, no screen, so I could log a cup in the middle of pouring.


Outcomes
My goal was 20% less by Week 4. I drank 43.75% less, from 32 cups a week to 18. The afternoon cups went first, falling from 12 and 14 a week to none by Weeks 5 and 6. In the last two weeks, with no guide or reminders, I still averaged 18, and my cups scored 4.50 against 3.69 at the start. I made about half my cups by hand in Weeks 3 to 6, not every one. My doctor wanted me down to about one a day, and I didn't get there.
I was the only person tested, and I ran the test, so I can't say whether making coffee by hand did it or simply paying this much attention did. None of the four ways it could fail happened, which makes me wonder if my hypothesis was too safe.
An A-B-A design: two normal weeks, four by hand, then two back to normal.
Afternoon cups fell from 12 and 14 a week to none by Weeks 5 and 6.
All 16 study files are here to download.