A map-data checker that works fully offline
Replacing a dying Windows program that checked contractors' map data for a federal agency's map-data program, with a React app built on the government's own design system
My role
Lead product designer
- Employer
- World Wide Technology
- Client
- A federal agency's map-data program
- Years
- 2018 to 2020
- Team
- Lead designer on a design team of four, alongside front-end and Python engineers
- Led the UX of the program that checks map data before it goes to the agency, and built its screens in React.
- Set up the weekly rhythm: one demo showing what we learned from users, the prototypes and the finished features, with research every two weeks.
- Led the design of, and helped build, more than 40 pieces the government design system was missing, each with instructions and automatic tests.
- Days→hours to check a batch of map data, as contractors told us; nobody timed it
- 2,000+ map files checked in the first month, by the delivery team's own counts
- 40+ screen parts the government design system lacked, built in React with tests
- WCAG 2.1 AA accessibility standard met, checked by us with tools and a screen reader, no outside auditor
Summary
Contractors had to send map data to a federal agency's map-data program with no errors in it. The only program that could check it was written in Visual Basic, and Microsoft was ending support for the Windows it needed, so contractors couldn't install it at all.
We replaced it with a web app wrapped in a desktop installer, so it runs on laptops that never connect to a network, on purpose. A check takes four guided steps, with no command line: drop the folder in, confirm it's complete, run the detailed checks, and download the report. I led the UX, built screens as one of the front-end engineers, and set the weekly habit that put what we heard from users straight into the work underway.
Who was involved
- Contractors Had to prove their map data was free of mistakes before sending it to the agency; they ran the tool on secure laptops in the field.
- Mapmakers Answered to their own leadership; nobody running the project thought of them as the customer.
- IT staff in closed networks Installed updates from removable drives, digitally signed so they knew the updates were genuine.
- The design team Two researchers, a technical product owner and me as lead designer.
- Front-end and Python engineers World Wide Technology's engineering team; I was one of the front-end engineers, building the screens in React.
- Program leads A product owner, a business analyst and a delivery lead.
- The agency's own team The agency's engineers and product owner worked alongside us, for a sponsor inside the agency.

Context
The old checker was written in Visual Basic, an old Microsoft programming language, and Microsoft had announced it would stop supporting the version of Windows it needed. Contractors couldn't install it at all, which put the whole requirement at risk. Using it meant clicking through one pop-up form after another while following a checklist from a binder six inches thick. Every submission took days.
Federal rules also said the new tool had to follow the U.S. Web Design System (USWDS), the government's design system. In 2018 that was little more than a style guide and a template file, meant for web pages, not for a working program.
Research
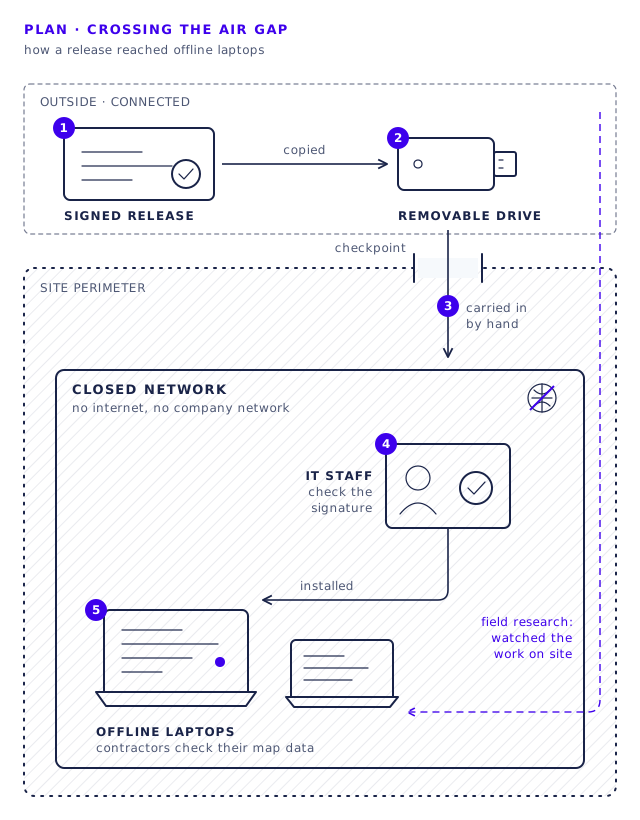
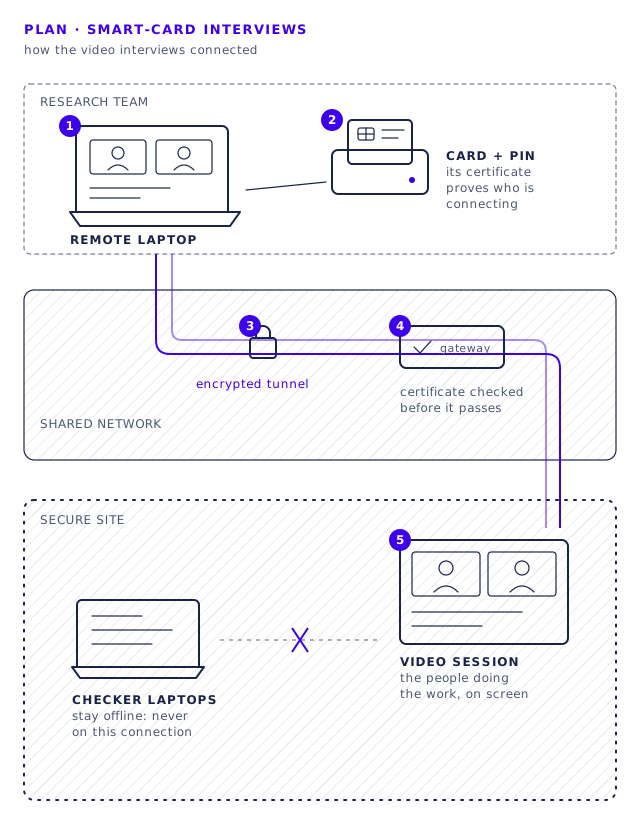
The research was field research. We went to the secure sites where the work happens to watch it, and interviewed by video the people our client contact pointed us to: the ones already doing this job the hard way, because they know best what the tool really has to do.
After that we did research every two weeks. Each weekly demo showed three things in one sitting: what we had learned from users, the prototypes we were designing, and the features we had finished. Every prototype had to answer something we had heard from users, and every finished feature had to match the prototype we agreed on.
Design
The new program is a web app wrapped in a desktop installer, so it installs like any desktop app and runs on computers with no network connection at all. A check takes four guided steps, with no command line: drop the folder in, confirm it's complete, run the detailed checks, and download the report. Updates came on removable drives, digitally signed so the IT staff inside those closed networks knew they were genuine.
The government's design system had nothing for a working program, like pop-up windows, step-by-step wizards or data tables, so we built more than 40 of those pieces ourselves in its style, in React. We wrote instructions and automatic tests for each one, and wrote accessibility into every feature's to-do list from the start instead of checking at the end.


More screens


Outcomes
Contractors told us checking a batch of map data went from taking days to taking hours, so they got their data to the agency sooner. Nobody kept a before-and-after timing, so that is their account, not a measurement. The tool checked more than 2,000 map files in its first month, by the delivery team's own usage counts. It met the federal accessibility standard (WCAG 2.1 AA); we checked that ourselves with automatic tools and a screen reader, and no outside auditor reviewed it.
The lesson that stuck with me wasn't technical. What got leadership on board was pitching the component library, our automatic scripts and our way of shipping updates as ways to keep the project from going wrong, not as UX extras. That also protected the plan when new requirements showed up late.
40+
Missing design system pieces, built in React with instructions and automatic tests.
Weekly
Demos of what we learned from users and the finished features, with research every two weeks.
What my delivery lead said
In all this, Bobby was indispensable. Not only was he skilled enough to jump into the look-n-feel and execution of the project, but he was extremely well-versed in human-centric design and helped mentor many of our consulting teammates in the practice as well. He had a strong urge to learn what he could from everyone on the team and to share what he knew. Overall, he was a great asset! He was a great teammate and I would love to work with him again in the future.
Matt Todd Delivery Lead