El protocolo del café de filtro
Mi médica me dijo que redujera el café. Hice un experimento prerregistrado conmigo mismo, con el objetivo de preparar cada taza a mano, para ver si bebía menos sin echarlo de menos. Al final, aproximadamente la mitad de mis tazas fueron hechas a mano.
Concluido
Mi papel
Diseñador, investigador y sujeto del estudio
- Tipo
- Un experimento conmigo mismo
- Cuándo
- Del 6 de enero al 21 de febrero de 2024
- Diseño
- A-B-A, ocho semanas
- Prerregistrado
- 5 de enero de 2024
- Planifiqué un experimento de ocho semanas conmigo mismo y anoté el objetivo y cuatro formas en que podía fracasar el día antes de la primera taza.
- Diseñé dos atajos de iPhone, Brew a Cup y Log a Cup, que me guiaban en cada preparación de café de filtro y registraban cada taza por voz.
- Hice un estudio de diario conmigo mismo durante las ocho semanas y lo comparé con ocho grabaciones mías preparando café.
- −44% menos café, frente a un objetivo del 20% menos anotado antes de la primera taza
- 32→18 tazas a la semana, y todavía 18 en las dos semanas posteriores a dejar la guía y los recordatorios
- 3.69→4.50 puntuación media sobre 5: las tazas que conservé eran mejores, no peores
- 56 de 56 días con el diario completado, registrado por voz con las manos mojadas
Resumen
Mi médica me dijo que redujera el café. Quería que bajara a más o menos una taza al día; yo fijé mi propio objetivo a partir de eso. No sabía cuánto bebía realmente, y quería reducirlo sin cambiar el café por algo peor.
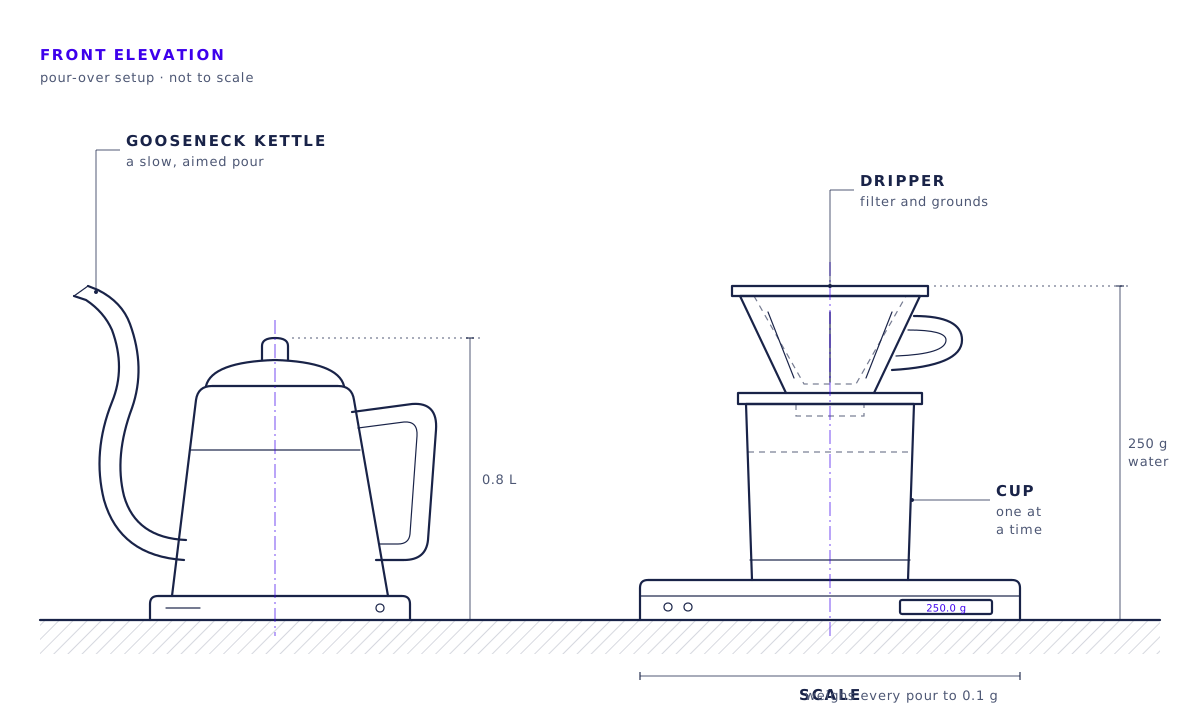
Así que, en lugar de limitar mis tazas, me propuse que cada una costara más trabajo: un café de filtro, hecho a mano, taza a taza. Si una taza lleva diez minutos, solo se prepara cuando de verdad se quiere. El objetivo era hacer cada taza a mano; en las cuatro semanas a mano preparé así aproximadamente la mitad, 36 de 72. Anoté el objetivo antes de contar una sola taza, diseñé dos atajos de iPhone para guiar y registrar mis tazas, y conté durante ocho semanas.
Quiénes participaron
- Yo La única persona estudiada, y la que dirigía el estudio.
- Mi médica Me dijo que redujera el café y quería que bajara a más o menos una taza al día. Revisó cómo iba en la semana 4 y me dijo que siguiera, y en la semana 6 acordamos que la bajada del 44% era aceptable.
Contexto
Trece tazas a la semana salían de la máquina cada tarde sin que lo pensara. Cuando mi médica me dijo que redujera el café, quería que bajara a más o menos una taza al día; yo fijé mi propio objetivo a partir de eso. Calculaba que tomaba tres o cuatro tazas al día.
Nunca fue un experimento médico. Cuenta tazas, y nunca pretendió sustituir el consejo de mi médica.
Investigación
Antes de cambiar nada, hice un estudio de diario conmigo mismo: durante dos semanas anoté cada taza y le di una puntuación del 1 al 5. Eso me dio mi punto de partida, la cantidad normal frente a la que se mediría cualquier cambio. Eran 32 tazas a la semana, una taza al día más de lo que había calculado. “Mucho más de lo que pensaba”, escribí en mis notas.
Después vinieron cuatro semanas intentando preparar cada taza a mano (lo logré con más o menos la mitad) y dos semanas de vuelta a lo normal, para ver si se mantenía. Los investigadores lo llaman un diseño A-B-A. Durante las semanas a mano me grabé preparando café ocho veces y comparé las grabaciones con el diario. Cuatro comprobaciones fallaron: una vez a mi diario le faltaba una taza, y tres veces mis propios tiempos se quedaron entre 68 y 100 segundos por debajo de la grabación, incluso después de cambiar mi forma de cronometrarme.
Investigación
Llevé el diario todos los días durante las ocho semanas. Durante las cuatro semanas a mano también me grabé preparando café, las ocho veces que había planeado, y comparé las grabaciones con el diario. Sobre el papel todo salió perfecto: 56 de 56 días de diario y solo el 2.1% de las preguntas opcionales en blanco. Por debajo fue más desordenado: cuatro de las comprobaciones dobles fallaron. Una encontró que a mi diario le faltaba una taza. Tres encontraron que mis propios tiempos se quedaban entre 68 y 100 segundos por debajo de las grabaciones, y cambiar mi forma de cronometrarme después del primer fallo no lo arregló. Una entrada de la semana 4 la completé a la mañana siguiente. Los 16 archivos se pueden descargar aquí, juntos o uno a uno.
| Semana | Fase | Tazas | Satisfacción |
|---|---|---|---|
| W1 | Semanas normales | 30 | 3.73 |
| W2 | Semanas normales | 34 | 3.65 |
| W3 | Semanas de preparación a mano | 21 | 3.62 |
| W4 | Semanas de preparación a mano | 18 | 4.33 |
| W5 | Semanas de preparación a mano | 17 | 4.71 |
| W6 | Semanas de preparación a mano | 16 | 4.81 |
| W7 | De vuelta a lo normal | 19 | 4.53 |
| W8 | De vuelta a lo normal | 17 | 4.47 |
Hipótesis nula
Las dos líneas del gráfico salen de mi hipótesis, escrita antes de empezar: beber menos y disfrutarlo al menos lo mismo. La forma en que esto podía salir mal era beber menos pero disfrutarlo menos. La línea inferior (3 de 5) es la mitad de mi escala de puntuación, “normal, sin más”. Si alguna semana bajaba de ahí, las tazas que seguía tomando serían peores que antes de empezar, y el experimento fracasaría. La línea superior (4 de 5) es el objetivo más exigente: mis tazas de referencia promediaban 3.69, así que mantenerme por encima de 4 significa que las tazas que conservé eran mejores que antes. Quedar entre las dos líneas significaría que no fracasó, pero que tampoco tuvo un éxito real.
Criterios de falsación
Cada uno se puntúa frente al umbral que fijé antes de empezar. El registro día a día se reconstruyó después, claramente marcado, y suma los mismos totales semanales. La lista de lagunas de abajo explica por qué.
| ID | Falla si | Umbral | Real | Resultado |
|---|---|---|---|---|
| FC-001 | reduction <20% | 0.2 | 0.44 | SUPERADO |
| FC-002 | satisfaction <3.0 | 3 | 3.62 mínimo | SUPERADO |
| FC-003 | abandonment before Week 6 | completar la semana 6 | completó todas las semanas | SUPERADO |
| FC-004 | washout rebound to baseline | sin volver al punto de partida | 18 frente a 32 de referencia | SUPERADO |
Semanas de referenciaSemanas 1 y 2
Solo observación
“Anotar cada taza, sin cambiar nada” 64 tazas en 14 días: 4.57 al día, con una puntuación de 3.69 sobre 5 y el 66% de las tazas tomadas en el trabajo.
Semanas a manoSemanas 3 a 6
Activa
“Cada taza, una decisión” 72 tazas en 28 días: 2.57 al día, con una puntuación de 4.37 sobre 5. Preparé 36 a mano, la mitad. Mi puntuación de destreza en las grabaciones pasó de 0.14 a 1.0 (sobre 1), y la proporción de tazas tomadas en casa subió del 27% al 57%.
De vuelta a lo normalSemanas 7 y 8
Solo observaciónSe cumplió
“¿Se mantiene cuando dejo de intentarlo?” 36 tazas en 14 días: 2.57 al día, con una puntuación de 4.50 sobre 5. Seguí preparando a mano el 42% de mis tazas.
Lagunas conocidas
- Mi objetivo escrito decía que mis tazas tenían que mantenerse por encima de 3 sobre 5. En todo lo demás me exigí el 4, más difícil, y esa es la línea con la que puntué.
- Había planeado exportar mi presión arterial cada día, pero dejé las mediciones diarias en la semana 4 (el 29 de enero de 2024 anoté “BP too noisy day-to-day”, la presión varía demasiado de un día a otro). Seguí tomando una medición a la semana. Las mediciones son privadas y están ocultas en los archivos. El registro semanal sigue el calendario reconstruido, así que su última fecha, el 24 de febrero, cae después del día en que dejé de contar.
- Mi lista de comprobación de diseño pedía que cada taza de las semanas a mano pasara por el atajo Brew a Cup. Solo la mitad se preparó a mano, así que esa comprobación falla tal como está escrita, y el propio registro del atajo no se conservó para contarlo.

Dos semanas normales en las que solo conté, para tener mi punto de partida, cuatro semanas intentando preparar cada taza a mano y luego dos semanas de vuelta a lo normal para ver si se mantenía. Las dos semanas normales me dijeron cuánto bebía de verdad antes de cambiar nada. Cada taza recibía una puntuación del 1 al 5 en el momento de tomarla. Ocho veces me grabé preparando café y comparé las grabaciones con el diario. Anoté todos los objetivos antes de contar la primera taza.
Yo era la única persona del estudio y lo dirigía yo, así que conocía todos los objetivos mientras generaba las cifras. No participó nadie más y no se me ocultó nada, así que la única comparación es yo frente a mí mismo en otro mes. El simple hecho de observarse tan de cerca puede cambiar lo que uno hace. Las mediciones de la presión arterial solo estaban para vigilar. Abarca solo ocho semanas.
Diseño
Diseñé dos atajos con Atajos, la app gratuita de Apple para iPhone que encadena pasos sencillos. Brew a Cup dice en voz alta cada uno de los nueve pasos del café de filtro, desde calentar el hervidor a 200°F hasta la última gota. Los pasos con un tiempo natural, como los tres minutos de molienda, llevan un temporizador; el resto espera a que yo diga “ready” (listo).
Cuando la taza está hecha, pasa el relevo a Log a Cup, que me pide puntuar la taza del 1 al 5 y guarda la respuesta con la hora. Sin escribir y sin pantalla, así que podía registrar una taza en mitad del vertido.


Resultados
Mi objetivo era un 20% menos en la semana 4. Bebí un 43.75% menos, de 32 tazas a la semana a 18. Las tazas de la tarde fueron las primeras en caer, de 12 y 14 a la semana a ninguna en las semanas 5 y 6. En las dos últimas semanas, sin guía ni recordatorios, seguí promediando 18, y mis tazas puntuaron 4.50 frente a 3.69 al principio. Preparé a mano aproximadamente la mitad de mis tazas en las semanas 3 a 6, no todas. Mi médica quería que bajara a más o menos una taza al día, y no llegué.
Yo era la única persona estudiada y dirigía el estudio, así que no puedo decir si fue preparar el café a mano o simplemente prestarle tanta atención. No ocurrió ninguna de las cuatro formas en que podía fracasar, lo que me hace pensar que mi hipótesis era demasiado prudente.
Un diseño A-B-A: dos semanas normales, cuatro a mano y luego dos de vuelta a lo normal.
Las tazas de la tarde bajaron de 12 y 14 a la semana a ninguna en las semanas 5 y 6.
Los 16 archivos del estudio se pueden descargar aquí.